March 2006 Sales: 12th Straight Month of Negative Sales Volume Change
These three graphs show sales of existing single-family homes in Sacramento County only. Click on any graph to enlarge it.
The first graph shows the year-over-year percent change in the number of homes sold. March marked the 12th straight negative month.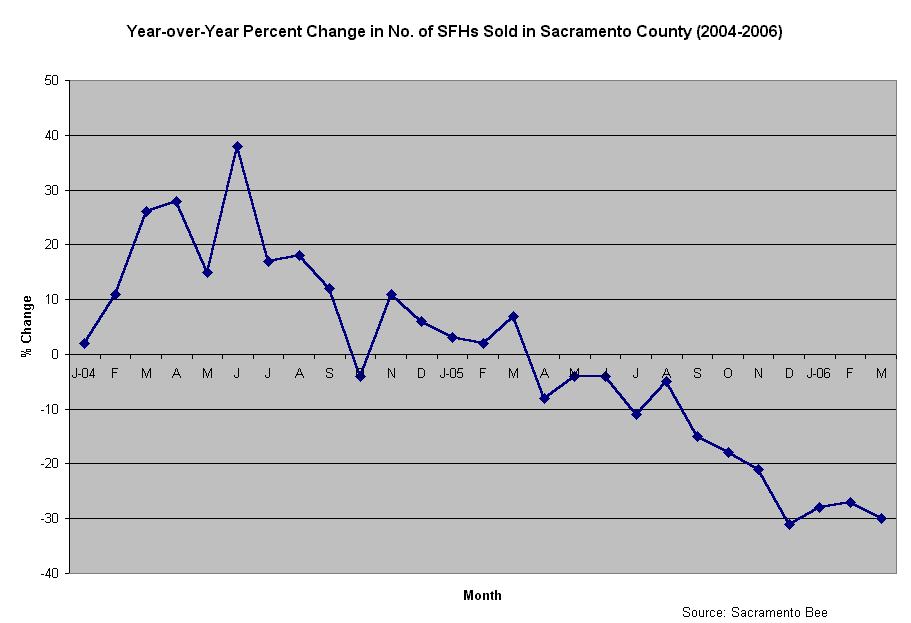
This next graph compares the number of monthly home sales in 2004, 2005, and 2006.
The last graph shows the number of homes sold between January 2004 and March 2006.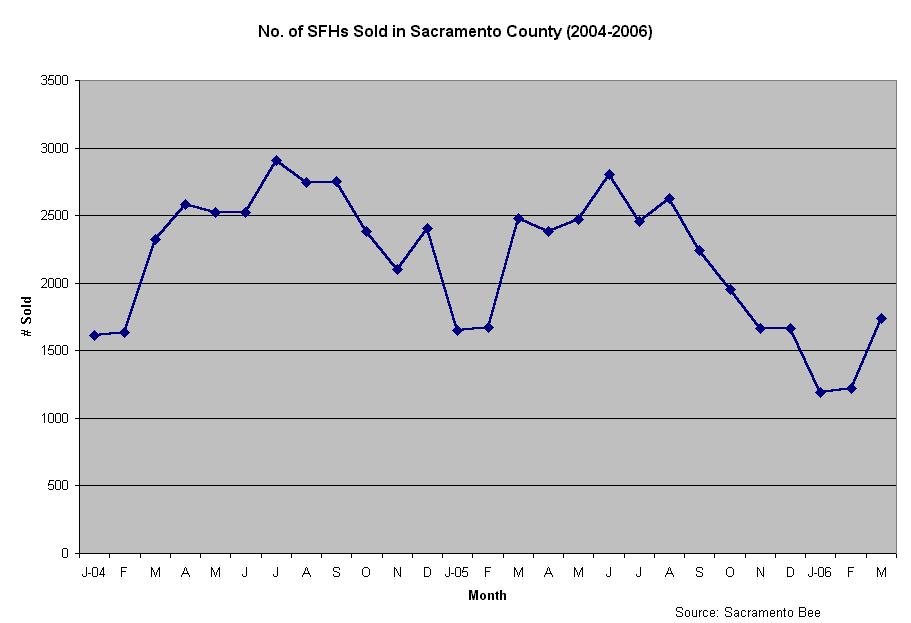 Return to Home
1 comment:
"Going down!?!"
Good work on the charts.
Thanks!
Post a Comment