Sacramento v. San Diego v. Boston v. DC Smackdown
The Paper Money blog has an interesting new tool for all you housing nerds out there. The tool allows you to compare the Office of Federal Housing Enterprise Oversight's House Price Index for multiple markets on a single graph. Here's the result for Sacramento, San Diego, Boston, and Washington D.C.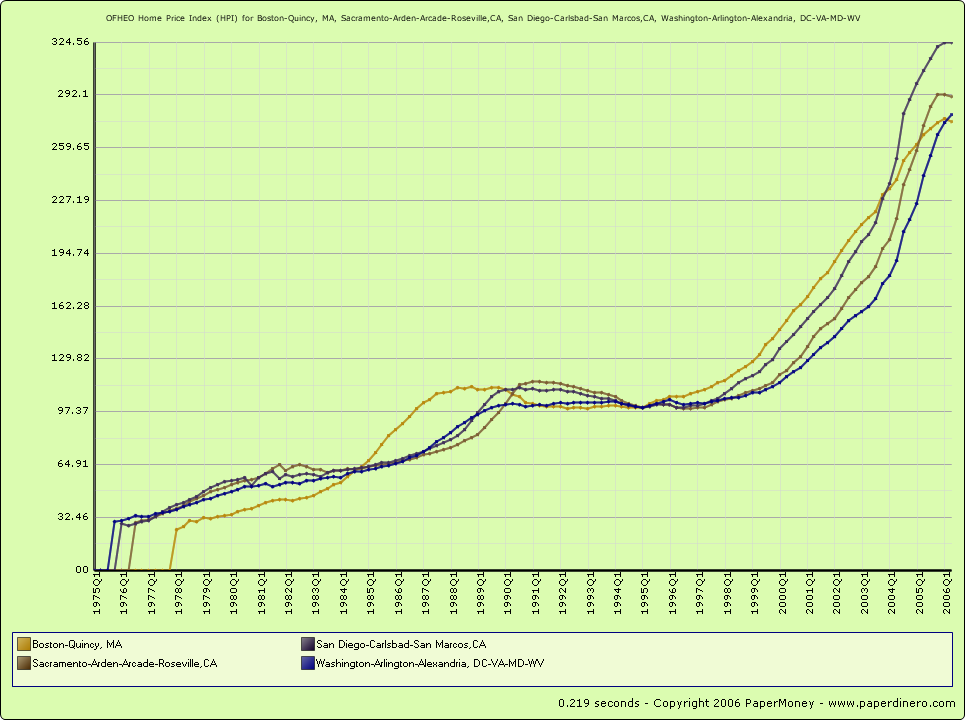
Click to enlarge
Anyone notice which market peaked first this time around?
12 comments:
thank you lander,i appreciate your work very much.
>> Anyone notice which market peaked first this time around? <<
It's kind of hard for me to tell because I'm colorblind and three of the lines look about the same color to me. I'll guess Sacramento though, since that's what this blog is about.
Sacramento will crumble as the speculators go back to the bay area.
If you believe the glass can be half full as well ..........click here http://drbrightside.blogspot.com/2006/09/state-job-statistics-stir-hope.html
My advice to anyone who is looking at employment/unemployment, GDP or any gov't produced numbers on the economy, is to take them with a grain a salt. Go and look at the actual data and I will bet you will end up scratching your head at how to reconcile this article and what the data said match. For instance from July to August the workforce in CA declined by 250K people (where did they go?). Employment was down by 100K people and unemployment was down by 51K. The kicker is the unemployment rate was down from 5.1% to 4.9% (all unadjusted). The adjusted numbers are workforce -100K, employment -135K, and unemployment +10K. How does this add up to California creating 47K new jobs. Your guess is as good as mine. I'm not making a political statement, I am just saying beware of what the gov't reports, they can cook any of these number anyway they want. If you’re a real glutton for punishment look up the difference between U1 and U3 to see what state the job market is in.
Does't this do some damage to one of the realtors(tm) tried and trule mantras: all markets are local?
How "local" in nature are these four cities?
OK, two are government centers, two others have biotech. One has beaches, another has mountains. One is hotter than a frying pan, without humidity in the summer, another one the same with humidity.
One is the world center of higher education, another has only one or two institutions of higher ed, that I can recall.
Well, they all have airports and interstate highways.
In truth, they don't have much in common except their real estate prices move together.
"... No, there's no large scale, national size bubble here... move along now. Nothing to see here."
And thanks for this post Lander.
SF Jack
the 4 markets on the chart are all similar, larger city/job centers where people want to live with planning restrictions (10 year+ horizons to get major housing developments into production).
When demand takes off like it did, supply can't keep up and prices spike...it will happen again and again!
Look at the charts for places nobody is going - Springfield, Bowling Green, etc. The appreciation is very flat over 20 years because (as my employees say) nobody wants to live there..there are no jobs.
The reason the spikes are occuring in the CA central valley, is people commute to their jobs.
HEY! IT'S BEEN A COUPLE OF DAYS!! PLEASE PUBLISH SOMETHING NEW! I CHECK THIS SITE A COUPLE OF TIMES A DAY. YOU NEED TO KEEP IT FRESH.
I'm in total agreement with rmbmsp. I'd like to include the inflationary or deflationary CPI and PPI as these numbers are "cooked" as well and do not reflect the real inflationary pressure on the RE Market. If it costs more for food, energy, and staples, then buyers must weigh these real time cost into their evaluation on whether they can afford to buy and at what price.
Yea you're right and charts like this that aren't using a logrithemic scale are misleading.
And I'll bet the jobs posted in the gain column were dominated by high paying, long term outlook type jobs that support the purchase of median priced homes in San Diego, Sacramento, the Bay area, LA/Orange, and Ventura counties. The fact is that real wages have been going down since 2000. Most of the unemployment numbers are bogus as well as they don't reflect those who have just given up trying to find a decent paying job. Sure you can go to work for Walmart or McDonalds or the local tanning salon, but you can't qualify for a home in the most rat-infested area in your community, much less rent a hovel in the same neighborhood. Not on these wages! We've exported too many middle income jobs to countries that will do it for less... and its cut into the very fabric that makes this country go.
Post a Comment